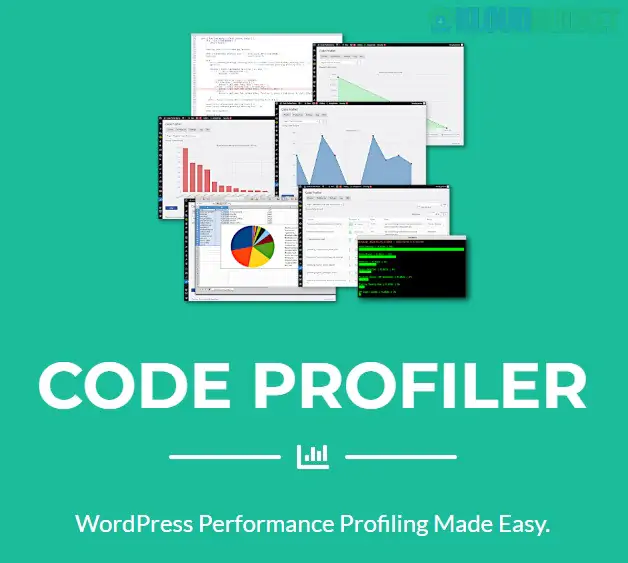
Code Profiler Pro is a high-performance WordPress plugin designed specifically for developers and site owners who need to identify exactly which plugins or themes are slowing down their website. Unlike generic speed test tools (like PageSpeed Insights), Code Profiler Pro analyzes the PHP execution and database queries happening on your server.
While most optimization tools tell you that your site is slow, Code Profiler Pro tells you why by measuring performance at the code level:
Plugin Performance Analysis: It generates a breakdown of how much execution time each active plugin consumes.
Theme Profiling: Identifies if your current theme has bloated code or inefficient functions.
Database Query Monitoring: Tracks slow SQL queries that may be hanging your server.
File I/O Tracking: Measures disk access speed, which is crucial for identifying issues with caching or heavy logging.
The Pro version extends the basic functionality with deeper diagnostic tools:
Script-Level Profiling: Drills down past the plugin name to show you the specific PHP scripts and functions causing the lag.
Front-end & Back-end Profiling: Allows you to profile the WordPress Admin dashboard (wp-admin) separately from the live site.
Exportable Reports: Generate detailed PDF or CSV reports to share with clients or development teams.
Advanced Charts: Visualizes resource consumption (CPU and Memory) over the duration of a page load.
Troubleshooting "White Screen of Death": Find the specific function that is timing out.
Optimization Audits: Before starting a speed optimization project, use this to see what should be deleted or replaced.
Developer Debugging: Perfect for plugin/theme developers to test the efficiency of their own code before release.
Hosting Issues: Determine if a slow site is caused by bad code or a restricted server environment.
Many developers use the free Query Monitor plugin. Here is how Code Profiler Pro differs:
| Feature | Query Monitor | Code Profiler Pro |
| :--- | :--- | :--- |
| Primary Focus | Database queries & Hooks | PHP Execution time & Resource usage |
| Visuals | Text-heavy tables | Graphical charts & Heatmaps |
| Ease of Use | Technical (Dev-centric) | User-friendly (Client-ready reports) |
| Deep Profiling | Limited to current page | Full stack script-level analysis |
Warning: Profiling is a resource-intensive task. It is highly recommended to run Code Profiler Pro on a staging site or during low-traffic periods, as the act of profiling itself can temporarily increase CPU load.
Install: Upload and activate the Pro version via Plugins > Add New.
Run Scan: Go to Tools > Code Profiler and click Profile Now.
Analyze: Look for the "Flame Graph" or the "Plugins" tab to see which item has the largest "Time" percentage.
Action: Deactivate the offending plugin or refactor the slow function identified in the script list.
Would you like me to help you interpret a specific performance report, or are you looking for tips on how to fix a slow plugin once Code Profiler Pro identifies it?
Subscribe to access unlimited downloads of themes, videos, graphics, plugins, and more premium assets for your creative needs.
Published:
Dec 30, 2025 17:27 PM
Version:
v1.6.5
Category:
Author:
OtherLicense:
GPL v2 or LaterTags: